What is Multisystem Inflammatory Syndrome in Children (MIS-C)?
Multisystem Inflammatory Syndrome in Children, or “MIS-C,” is a rare health condition that can occur in children and teens under 21 years of age who were infected with SARS-CoV-2 (the virus that causes COVID-19). Children with MIS-C get inflammation in different parts of the body (“organ systems”) up to eight weeks after being infected with SARS-CoV-2. This inflammation can occur whether the child did or did not have symptoms of COVID-19. Organ systems that can be affected by MIS-C can include: the heart, lungs, kidneys, brain, skin, eyes, and/or gastrointestinal organs. Because it is caused by SARS-CoV-2, MIS-C is a new condition that was first reported in April, 2020.
MIS-C Cases, California
MIS-C case reporting and abstraction may be delayed due to limited capacity at local health departments and as CDPH assesses data to ensure patients meet the MIS-C case definition. Surveillance data are preliminary and subject to change.
CDPH data was last updated 03/13/2023. Data are updated on the second Monday of each month.
MIS-C & COVID-19 Cases in California by Week of Onset

There were a total of 1,048 reported MIS-C cases in California from March 23, 2020 (when tracking began) to March 13, 2023. Because MIS-C case numbers tend to rise around three to eight weeks following a surge in COVID-19 cases, recent increases in COVID-19 in the community may not yet be reflected in MIS-C case numbers. Please note that the MIS-C cases have been scaled for visibility on the above graph. The graph has been updated to show <21 COVID-19 cases only.
Download the
MIS-C & COVID-19 Cases in California by Week of Onset (Excel).
MIS-C Disease Severity
While overall mortality from MIS-C remains low in California (under 1%), the disease can be severe. Approximately half of children with MIS-C in California were admitted to the ICU.
MIS-C Demographic and Disease Severity Highlights, California & United States
| Variables | California* | United States**
|
| Cases | 1,085
| 9,370
|
| Deaths | 10
| 76
|
| ICU Admission | 47.6% | -- |
| Median Age | 8 years | 9 years |
| Sex | Male (62%) | Male (60%)
|
Cumulative MIS-C Case Rate by Health Officer Region
The cumulative MIS-C case rate for California is 9.97 per 100,000 persons. Regional differences in case burden may be due to several factors including level of community transmission, health inequities, more awareness and reporting by health care providers, and properties of the virus that we still are learning about. Since all confirmed cases of MIS-C require hospitalization, these different regional impacts may strain an already impacted health system from COVID-19.
| California | All | 9.97 |
| Bay Area | Alameda, Contra Costa, Marin, Monterey, Napa, San Francisco, San Mateo, Santa Clara, Santa Cruz, Solano, Sonoma | 5.55
|
| Greater Sacramento | Alpine, Amador, Butte, Colusa, El Dorado, Nevada, Placer, Plumas, Sacramento, Sierra, Sutter, Yolo, Yuba | 7.29
|
| Northern California | Del Norte, Glenn, Humboldt, Lake, Lassen, Mendocino, Modoc, Shasta, Siskiyou, Tehama, Trinity | 4.60
|
| San Joaquin Valley | Calaveras, Fresno, Kern, Kings, Madera, Mariposa, Merced, San Benito, San Joaquin, Stanislaus, Tulare, Tuolumne | 12.80
|
| Southern California | Imperial, Inyo, Los Angeles, Mono, Orange, Riverside, San Bernardino, San Diego, San Luis Obispo, Santa Barbara, Ventura | 11.28
|
1 The population denominators by region come from the California Department of Finance's population projections for 2020.
MIS-C Comorbidities, California
About half of children and teens who had MIS-C had no known previous health conditions or "comorbidities" (52%). The other half of children with MIS-C had a known or reported existing medical condition, the most common being reported as "other"2 and obesity. About 1 in 6 cases of children with MIS-C had two or more underlying medical conditions.
Other2”2
| 29.1%
|
Obesity
| 21.7%
|
Lung Disease
| 7.5%
|
Other Congenital Malformation
| 2.9%
|
Seizures
| 2.1%
|
Congenital Heart Disease
| 1.9%
|
Malignancy
| 1.5%
|
Diabetes
| 0.8%
|
Sickle Cell
| 0.8%
|
1Includes all comorbidities on the CDC's
MIS-C Case Report Form (PDF).
2The “other” category is a free text variable, and includes reporting of conditions such as ADHD, depression, autism spectrum disorder, hyperlipidemia, hypertension, eczema, irregular heart rate, thalassemia, sickle cell trait, overweight but not obese, hypothyroidism.
MIS-C Cases
by Healthy Places Index (Estimated by Census Tract), California
The COVID-19 pandemic has highlighted health disparities and led to a
disproportionate number of cases in certain communities, especially communities of color. Social determinants of health, such as lower median income, decreased access to health care, and more crowded housing, interact to increase the risk of COVID-19 infection. Since MIS-C can occur after a COVID-19 infection, the same communities that are more severely impacted by COVID-19 also experience more cases of MIS-C.
The
California Healthy Places Index (HPI), a tool developed by the Public Health Alliance of Southern California, helps to explore the community conditions that predict life expectancy. Applying the HPI to MIS-C cases in California reveals the vast inequities between those living in healthier community conditions (more advantaged groups) compared to those living in less healthy community conditions (less advantaged groups).
Of the data available, about 68% of MIS-C cases were in the two lowest advantaged quartiles (scoring lowest on the HPI), and about 42% of MIS-C cases were in the least advantaged quartile alone, meaning a large percentage of MIS-C cases were from residents of less advantaged communities.
Least Advantaged
(Quartile 1)
| 41.7%
|
Somewhat Advantaged
(Quartile 2)
| 26%
|
Advantaged
(Quartile 3)
| 17.8%
|
Most Advantaged
(Quartile 4) | 9.9%
|
|
Missing | 4.7%
|
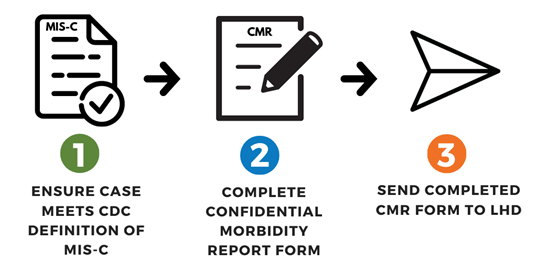
Reporting MIS-C Cases
In order to get a better picture of the burden of MIS-C in California, health care professionals and hospital infection personnel should report all cases that meet the CDC definition of MIS-C using the COVID-19 Confidential Morbidity Report (CMR) (PDF - note MIS-C under “Additional Remarks”) to their local health department (LHD).
MIS-C Resources for Health Professionals
*California MIS-C Data last updated by CDPH on 03/13/2023